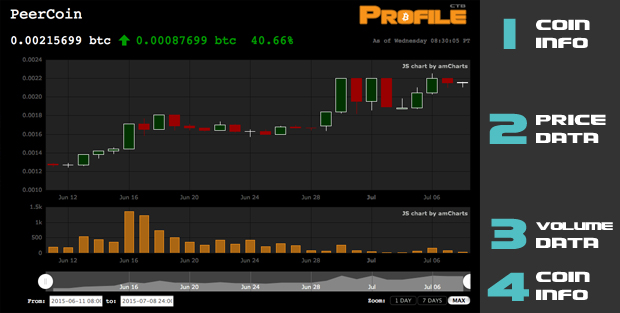
We love graphs! But there are so many graphs and graphing packages out there, we thought we would put together a little tutorial on how to look at our maps, and what each area represents. We hope you will find it useful!

Section 1: Coin Information
Here you will find the name of the coin, it’s current price, and it’s price change over the last 24 hours. Prices that go down are denoted in red, prices that go up, in green. Continue reading


